- Published on
Setup Prometheus and Grafana on Kubernetes Using Helm


Kubernetes is a complex system with many moving parts. Effective monitoring of such a dynamic system requires tools with advanced capabilities. Prometheus is one such application.
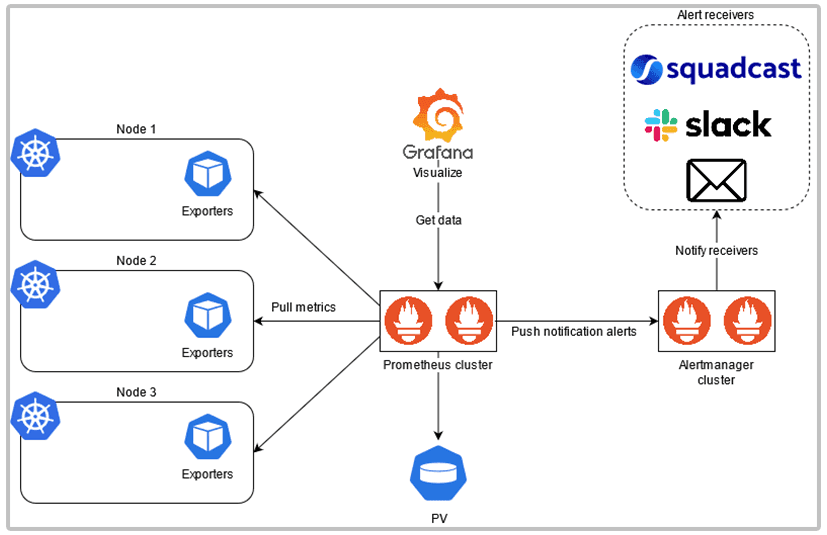
Prometheus is an open-source monitoring solution that can collect metrics from a number of target systems. It collects and stores the metrics as time-series data. It also features an excellent alerting mechanism that can integrate with popular team collaboration and incident management tools.
Why is Kubernetes monitoring important?
The explosive growth of containers in enterprise-level businesses has brought many advantages to developers, DevSecOps , and IT teams worldwide. However, the flexibility and scalability that Kubernetes brings in deploying containerized applications also presents new challenges. Since there is no longer a 1-to-1 correlation between an application and the server it runs on, keeping track of the health of applications — abstracted by containers and abstracted once again by Kubernetes — can be daunting without the proper tools.
One of the main areas to monitor is the physical Kubernetes infrastructure, which includes th e Node resources—CPU, RAM, network latency, or disk I/O. Another area is the Pods (for example, the number of currently running Pods against the configured value or the number of Pods per Node Group, and so on)
Introduction to Prometheus
Prometheus is an open-source monitoring system specifically designed for containers and microservices. It collects and aggregates metrics as time-series data , enabling users to execute flexible queries and create real-time alerts.
Deploy Prometheus
- Deploy Prometheus usign Helm
  # Create namespace
  kubectl create namespace prometheus

  # add repo
  helm repo add prometheus-community https://prometheus-community.github.io/helm-charts

  # Install
  helm install prometheus prometheus-community/prometheus \
  --namespace prometheus \
  --set alertmanager.persistentVolume.storageClass="gp2",server.persistentVolume.storageClass="gp2"

  # list pod
  kubectl get all -n prometheus

  # In order to access Prometheus server URL
  kubectl port-forward -n prometheus deploy/prometheus-server 8080:9090
- To use "gp2" storageClass you need to create IAM role and Policy first
  #  Add IAM Role and Policy using eksctl
  eksctl create iamserviceaccount \
    --name ebs-csi-controller-sa \
    --namespace kube-system \
    --cluster <cluster_name>\
    --role-name AmazonEKS_EBS_CSI_DriverRole \
    --role-only \
    --attach-policy-arn arn:aws:iam::aws:policy/service-role/AmazonEBSCSIDriverPolicy \
    --approve

  # add add-on on eks-cluster
  eksctl create addon --name aws-ebs-csi-driver --cluster <cluster_name> --service-account-role-arn \
    arn:aws:iam::<accont_id>:role/AmazonEKS_EBS_CSI_DriverRole \ --force
Deploy Grafana
Grafana is a multi-platform that gets data from a data source such as Prometheus and transforms it into visualizations charts. This article will teach you how to integrate Prometheus and Grafana on Kubernetes using Helm.
- Deploy Grafana using helm
# Create namespace
kubectl create namespace grafana

# add grafana Helm repo
helm repo add grafana https://grafana.github.io/helm-charts
- Create datasource.yml file and paste this
datasources:
  datasources.yaml:
    apiVersion: 1
    datasources:
    - name: Prometheus
      type: prometheus
      url: http://prometheus-server.prometheus.svc.cluster.local
      access: proxy
      isDefault: true
- Install grafana with datasource.yml file
helm install grafana grafana/grafana \
    --namespace grafana \
    --set persistence.storageClassName="gp2" \
    --set persistence.enabled=true \
    --set adminPassword='admin@123' \
    --values datasource.yml \
    --set service.type=LoadBalancer

# List grafana resources
kubectl get all -n grafana


# Grafana dashboard
ID: 14623