- Published on
Setup Prometheus Monitoring On Kubernetes Cluster


This Prometheus blog will guide you to setup up prometheus on a Kubernetes cluster for monitoring the Kubernetes cluster.
Prometheus is a high-scalable open-source monitoring framework. It provides out-of-the-box monitoring capabilities for the Kubernetes container orchestration platform. Also, In the observability space, it is gaining huge popularity as it helps with metrics and alerts.
Explaining Prometheus is out of the scope of this articles. If you want to know more, please visit Prometheus
Prometheus Architecture
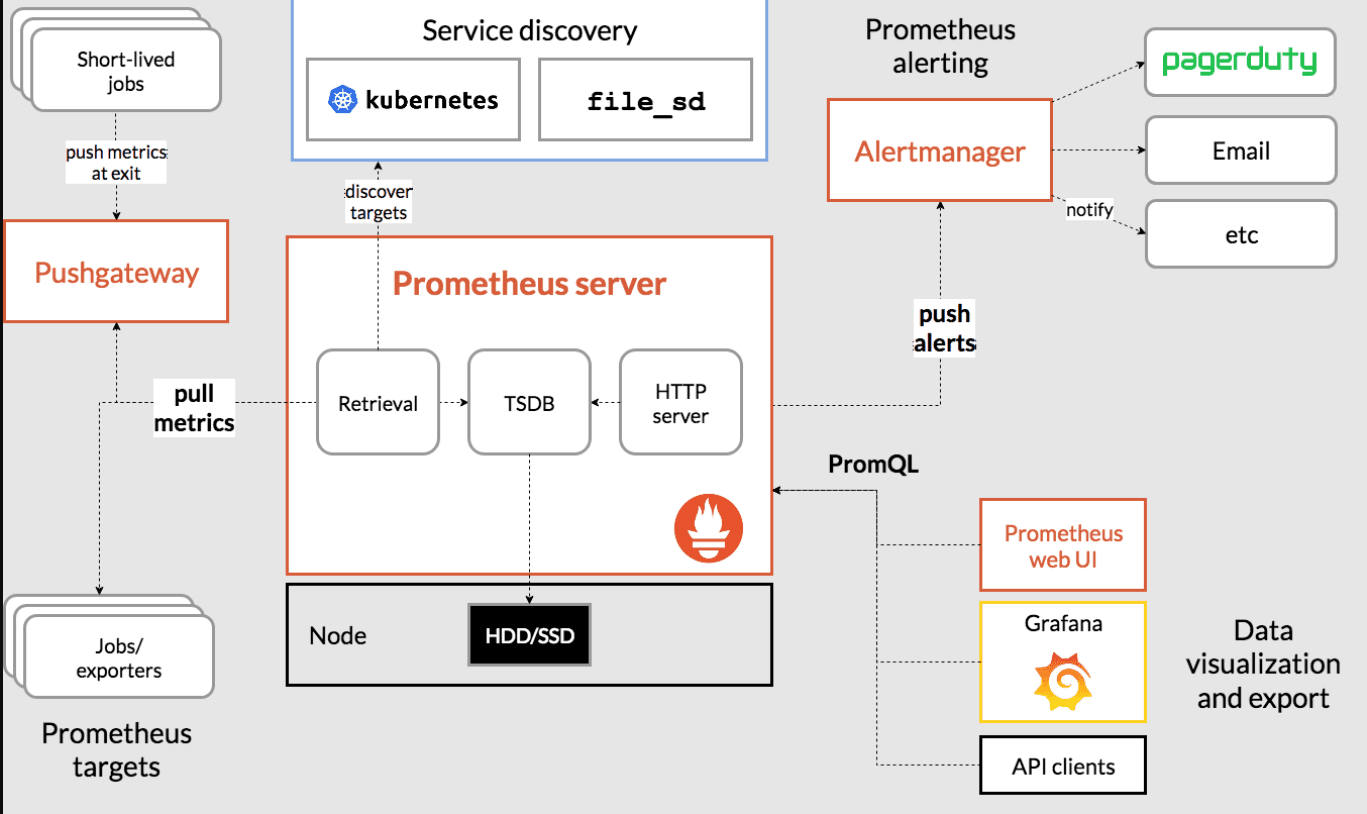
The Kubernetes Prometheus monitoring stack has the following components. 1. Prometheus server 2. Alert Manager 3. Grafana
Without wasting time, let's do it.
Connect to the Kubernetes Cluster
Connect to your Kubernetes cluster and make sure you have admin privileges to create cluster roles.
aws eks --region <region-name> update-kubeconfig --name <cluster-name>
Prometheus Kubernetes Manifest Files
All configuration files can be found in Github. You can use the GitHub repo config files or create the files on the go for a better understanding, as mentioned in the steps.
Let’s get started with the setup.
Create a Namespace & ClusterRole
First, we will create a Kubernetes namespace for all our monitoring components. If you don’t create a dedicated namespace, all the Prometheus kubernetes deployment objects get deployed on the default namespace.
kubectl create namespace monitoring
Prometheus uses Kubernetes APIs to read all the available metrics from Nodes, Pods, Deployments, etc. For this reason, we need to create an RBAC policy with read access to required API groups and bind the policy to the monitoring namespace.
Step 1: Create a file named clusterRole.yaml and copy the following RBAC role.
Note: In the role, given below, you can see that we have added get, list, and watch permissions to nodes, services endpoints, pods, and ingresses. The role binding is bound to the monitoring namespace. If you have any use case to retrieve metrics from any other object, you need to add that in this cluster role.
apiVersion: rbac.authorization.k8s.io/v1
kind: ClusterRole
metadata:
  name: prometheus
rules:
- apiGroups: [""]
  resources:
  - nodes
  - nodes/proxy
  - services
  - endpoints
  - pods
  verbs: ["get", "list", "watch"]
- apiGroups:
  - extensions
  resources:
  - ingresses
  verbs: ["get", "list", "watch"]
- nonResourceURLs: ["/metrics"]
  verbs: ["get"]
---
apiVersion: rbac.authorization.k8s.io/v1
kind: ClusterRoleBinding
metadata:
  name: prometheus
roleRef:
  apiGroup: rbac.authorization.k8s.io
  kind: ClusterRole
  name: prometheus
subjects:
- kind: ServiceAccount
  name: default
  namespace: monitoring
Step 2: Create the role using the following command.
kubectl create -f clusterRole.yaml
Create a Config Map To Externalize Prometheus Configurations
All configurations for Prometheus are part of prometheus.yaml file and all the alert rules for Alertmanager are configured in prometheus.rules.
- prometheus.yaml: This is the main Prometheus configuration which holds all the scrape configs, service discovery details, storage locations, data retention configs, etc
- prometheus.rules: This file contains all the Prometheus alerting rules
By externalizing Prometheus configs to a Kubernetes config map, you don’t have to build the Prometheus image whenever you need to add or remove a configuration. You need to update the config map and restart the Prometheus pods to apply the new configuration.
The config map with all the Prometheus scrape config and alerting rules gets mounted to the Prometheus container in /etc/prometheus location as prometheus.yaml and prometheus.rules files.
Step 2: Execute the following command to create the config map in Kubernetes.
kubectl create -f config-map.yaml
It creates two files inside the container.
The prometheus.yaml contains all the configurations to discover pods and services running in the Kubernetes cluster dynamically. We have the following scrape jobs in our Prometheus scrape configuration.
- kubernetes-apiservers: It gets all the metrics from the API servers.
- kubernetes-nodes: It collects all the kubernetes node metrics.
- kubernetes-pods: All the pod metrics get discovered if the pod metadata is annotated with prometheus.io/scrape and prometheus.io/port annotations.
- kubernetes-cadvisor: Collects all cAdvisor metrics.
- kubernetes-service-endpoints: All the Service endpoints are scrapped if the service metadata is annotated with prometheus.io/scrape and prometheus.io/port annotations. It can be used for black-box monitoring.
prometheus.rules contains all the alert rules for sending alerts to the Alertmanager.
Create a Prometheus Deployment
Step 1: Create a file named prometheus-deployment.yaml and copy the following contents onto the file.
In this configuration, we are mounting the Prometheus config map as a file inside /etc/prometheus as explained in the previous section.
apiVersion: apps/v1
kind: Deployment
metadata:
  name: prometheus-deployment
  namespace: monitoring
  labels:
    app: prometheus-server
spec:
  replicas: 1
  selector:
    matchLabels:
      app: prometheus-server
  template:
    metadata:
      labels:
        app: prometheus-server
    spec:
      serviceAccountName: prometheus
      containers:
        - name: prometheus
          image: prom/prometheus
          args:
            - "--storage.tsdb.retention.time=12h"
            - "--config.file=/etc/prometheus/prometheus.yml"
            - "--storage.tsdb.path=/prometheus/"
          ports:
            - containerPort: 9090
          resources:
            requests:
              cpu: 500m
              memory: 500M
            limits:
              cpu: 1
              memory: 1Gi
          volumeMounts:
            - name: prometheus-config-volume
              mountPath: /etc/prometheus/
            - name: prometheus-storage-volume
              mountPath: /prometheus/
      volumes:
        - name: prometheus-config-volume
          configMap:
            defaultMode: 420
            name: prometheus-server-conf

        - name: prometheus-storage-volume
          emptyDir: {}
Step 2: Create a deployment on monitoring namespace using the above file.
kubectl create -f prometheus-deployment.yaml
Step 3: You can check the created deployment using the following command.
kubectl get deployments --namespace=monitoring
Connecting To Prometheus Dashboard
You can view the deployed Prometheus dashboard in three different ways.
- Using Kubectl port forwarding
- Exposing the Prometheus deployment as a service with NodePort or a Load Balancer.
- Adding an Ingress object if you have an Ingress controller deployed.
Method 1: Using Kubectl port forwarding
Step 1: First, get the Prometheus pod name.
kubectl get pods --namespace=monitoring
The output will look like the following.
NAME                                     READY     STATUS    RESTARTS   AGE
prometheus-deployment-86f88575bf-gxfrr   1/1       Running   0          5m
Step 2: Execute the following command with your pod name to access Prometheus from localhost port 8080.
kubectl port-forward pprometheus-deployment-86f88575bf-gxfrr 8080:9090 -n monitoring
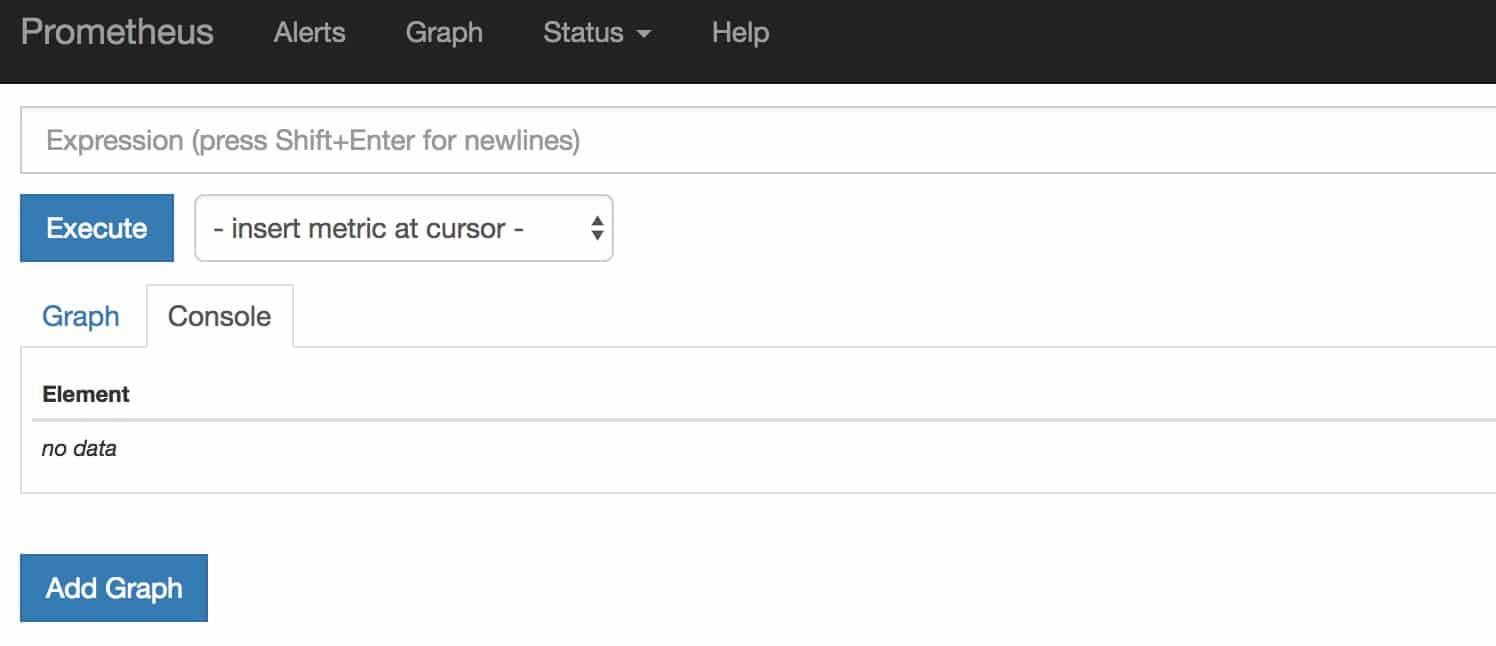
Step 3: Now, if you access http://localhost:8080 on your browser, you will get the Prometheus home page.
Method 2: Exposing Prometheus as a Service [NodePort & LoadBalancer]
To access the Prometheus dashboard over a IP or a DNS name, you need to expose it as a Kubernetes service.
Step 1: Create a file named prometheus-service.yaml and copy the following contents. We will expose
Prometheus on all kubernetes node IP’s on port 30000.
Note: If you are on AWS, Azure, or Google Cloud, You can use Loadbalancer type, which will create a load balancer and automatically points it to the Kubernetes service endpoint.
    apiVersion: v1
kind: Service
metadata:
  name: prometheus-service
  namespace: monitoring
  annotations:
      prometheus.io/scrape: 'true'
      prometheus.io/port:   '9090'
spec:
  selector:
    app: prometheus-server
  type: NodePort
  ports:
    - port: 8080
      targetPort: 9090
      nodePort: 30000
The annotations in the above service YAML makes sure that the service endpoint is scrapped by Prometheus. The prometheus.io/port should always be the target port mentioned in service YAML
Step 2: Create the service using the following command.
kubectl create -f prometheus-service.yaml --namespace=monitoring
Step 3: Once created, you can access the Prometheus dashboard using any of the Kubernetes node’s IP on port 30000.
If you are on the cloud, make sure you have the right firewall rules to access port 30000 from your workstation.
Step 4: Now if you browse to status --> Targets, you will see all the Kubernetes endpoints connected to Prometheus automatically using service discovery as shown below.
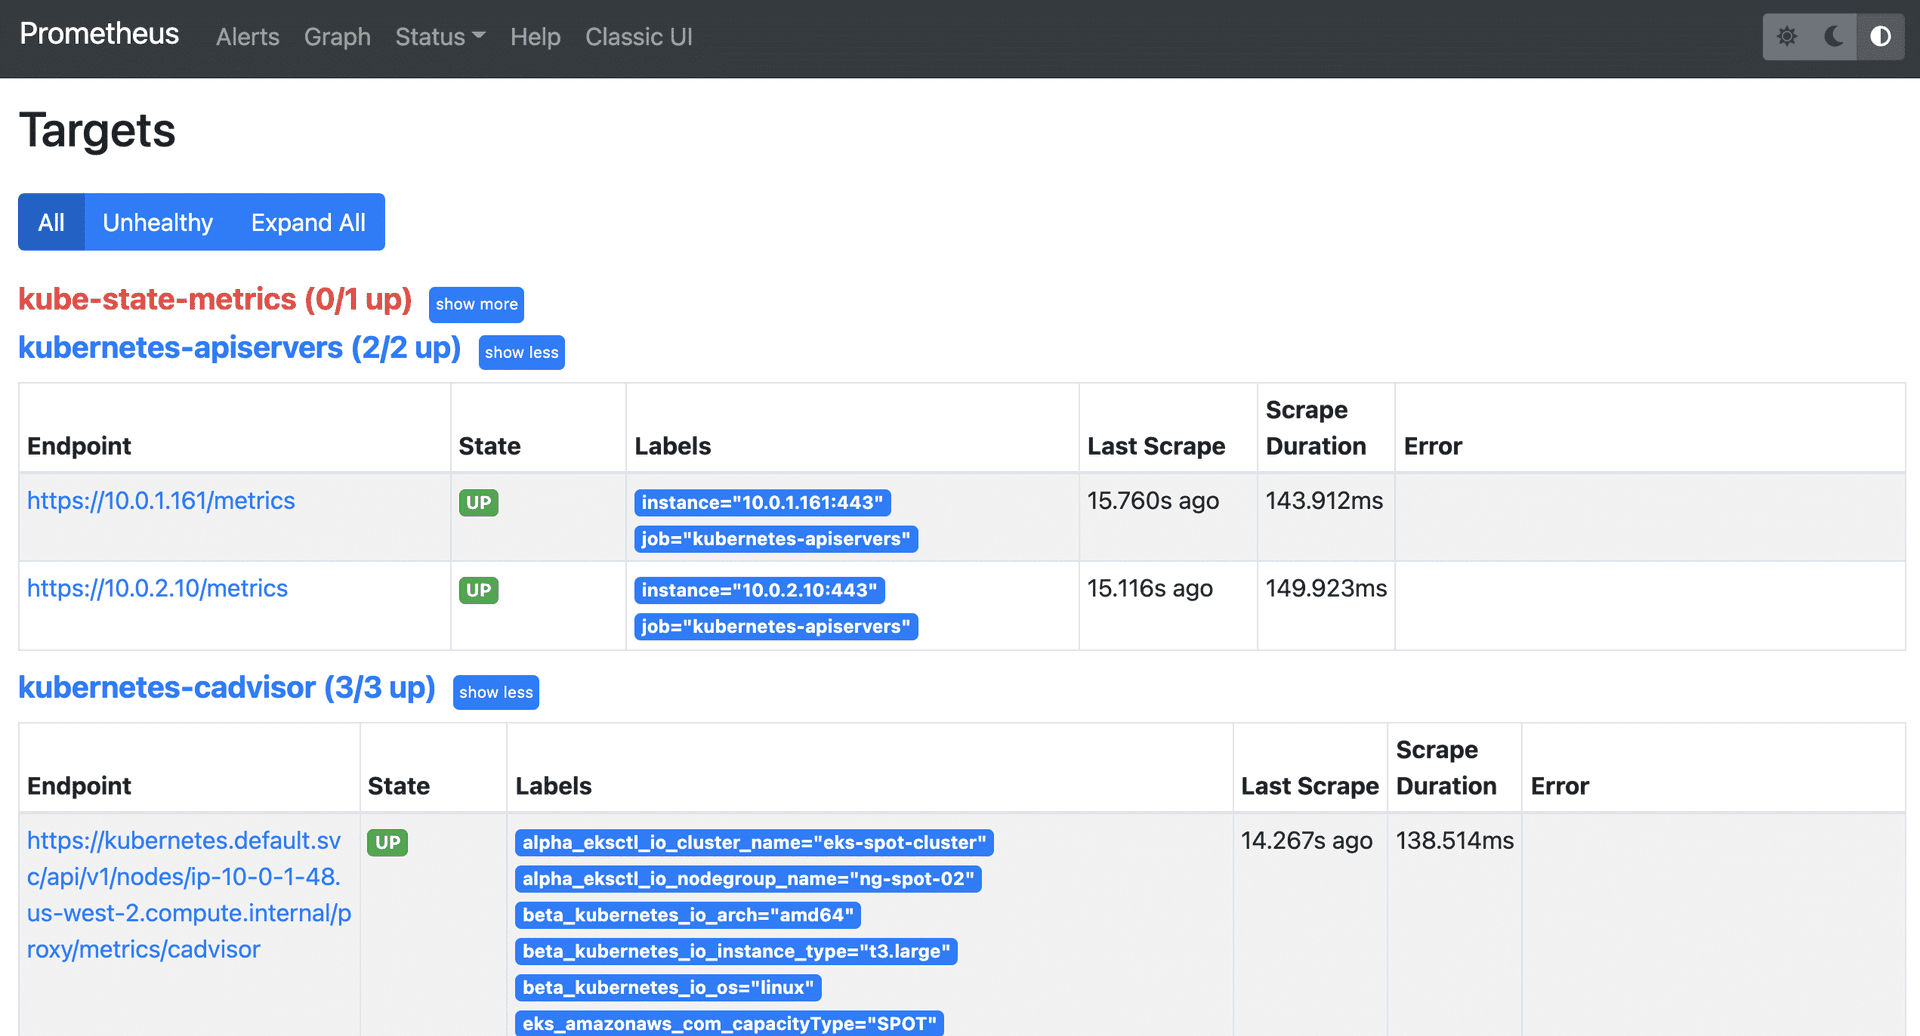
The kube-state-metrics down is expected and I’ll discuss it shortly.
Method 3: Exposing Prometheus Using Ingress
If you have an existing ingress controller setup, you can create an ingress object to route the Prometheus DNS to the Prometheus backend service.
apiVersion: extensions/v1beta1
kind: Ingress
metadata:
  name: prometheus-ui
  namespace: monitoring
  annotations:
    kubernetes.io/ingress.class: alb
spec:
  ingressClassName: alb
  rules:
  # Use the host you used in your kubernetes Ingress Configurations
  - host: prometheus.example.com
    http:
      paths:
      - backend:
          serviceName: prometheus-service
          servicePort: 8080
Setting Up Kube State Metrics
Kube state metrics service will provide many metrics which is not available by default. Please make sure you deploy Kube state metrics to monitor all your kubernetes API objects like deployments, pods, jobs, cronjobs etc.
Please follow Setup Kube State Metrics on Kubernetes
Setting Up Alertmanager
Alertmanager handles all the alerting mechanisms for Prometheus metrics. There are many integrations available to receive alerts from the Alertmanager (Slack, email, API endpoints, etc)
Please follow Set Up Alertmanager
Setting Up Grafana
Using Grafana you can create dashboards from Prometheus metrics to monitor the kubernetes cluster.
The best part is, you don’t have to write all the PromQL queries for the dashboards. There are many community dashboard templates available for Kubernetes. You can import it and modify it as per your needs.
Please follow Set Up Grafana
Setting Up Node Exporter
Node Exporter will provide all the Linux system-level metrics of all Kubernetes nodes.
The scrape config for node-exporter is part of the Prometheus config map. Once you deploy the node-exporter, you should see node-exporter targets and metrics in Prometheus.
Please follow Set up Node Exporter
Prometheus Production Setup Considerations
For the production Prometheus setup, there are more configurations and parameters that need to be considered for scaling, high availability, and storage. It all depends on your environment and data volume.
Conclusion
In this comprehensive Prometheus kubernetes tutorial, I have covered the setup of important monitoring components to understand Kubernetes monitoring.
In the next blog, I will cover the Prometheus setup using helm charts. We will have the entire monitoring stack under one helm chart.